Suppose you have a dataset of shapes. They can either be shaded or unshaded. They look something like this:
You built a supervised machine learning classifier that will automatically classify each shape as shaded or unshaded. You call it the “Is-Shaded Classifier”.
Click “Run Classifier” to see how your model performs.
It’s not perfect— some of the shapes are definitely misclassified. You want to improve your model!
To do so, you want to know more about the kinds of mistakes your model is making.
In training, you only gave your model the raw image of each shape and one ground truth label: shaded and unshaded. But maybe something about your model—the distribution of the training data you used, the architecture you chose, or how you set your hyperparameters—resulted in your model performing better on some shapes than others.
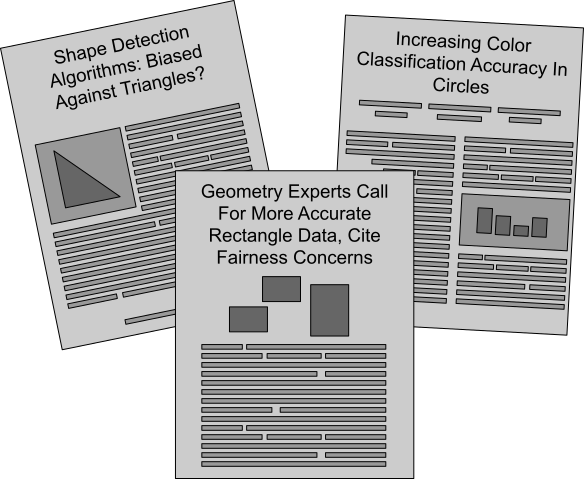
In fact, you’ve seen a lot of papers and articles citing issues of biased model performance between circles, triangles, and rectangles in shape data. One paper finds that shape detection algorithms tend to do worse on triangles; another article says color accuracy is an issue with circles. So you wonder: are there biases in your model’s misclassifications?
You want to make sure that your model is performing equally well across circles, triangles, and rectangles, so you decide to do a fairness analysis.
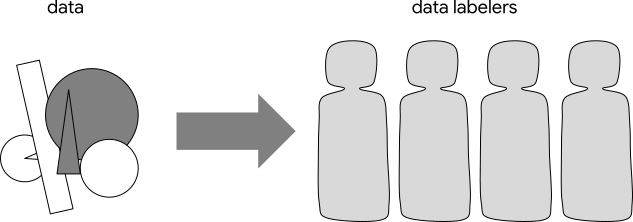
There’s just one issue: you don’t have labels for which of your shapes are circles, triangles, or rectangles.
So, you decide to send your data to data labelers.
You receive feedback from your data labeling team that they’re not sure what to do with the shapes that aren’t exactly circles, triangles, or rectangles.
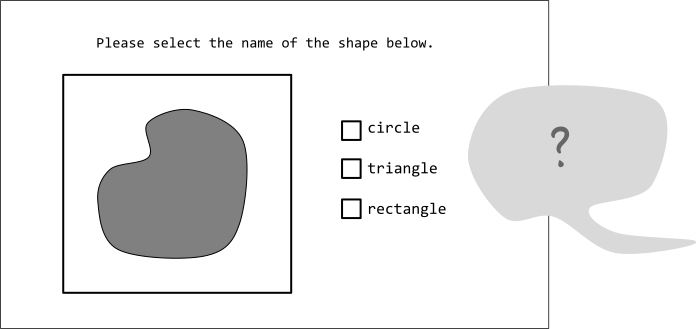
For the shapes that are unclear, you can have them use their best guess or simply label them as “other”. Then, you can finally do some fairness analysis!
Below is the interface they see:
These shapes should be labeled…
If you go back and change the labelers’ instructions, which shapes do you perform worst on? Where do you find bias?
You notice that your results hinge on how you choose to classify the shapes in our data.
Because ultimately, this isn’t a world of only circles, triangles, and rectangles!
What could we find out about our classifier’s performance if we used different categories altogether?
All shapes are basically…
Everything else should be labeled…
With each of the different categories, which shapes do you perform worst on? Where do you find bias?
Each way of categorizing your shapes takes a different stance about what’s important . Each one makes some features more important than others, it make some distinctions visible and other distinctions invisible, and make some things easy to classify while others become outliers.
And each one tells you something different about what kind of bias your classifier has!
Here’s another way to look at the same results. We can draw all the shapes that were correctly classified above the dashed line, and all the incorrectly classified shapes below it.
We’re still looking at the same model making the same classification on the same shapes, so the same shapes stay above and below the line. But each way of grouping the results distributes the errors differently— each way tells you something different.
The decisions you make about classification, however small…
…begin to shape others’ decisions…
…they shape the analysis you can do…
…and they shape the kinds of conversations that happen.
It’s natural to want to find a way out of this problem by gathering more features or collecting more data. If we just have enough detail on enough data, surely we can avoid making these kinds of decisions, right?
Unfortunately, that isn’t the case. Describing the world around us in any way—whether we’re telling a friend a story or telling a computer about shapes—requires us to choose what information is important to convey and what tools we want to use to convey it.
Whether we think about it or not, we’re always making choices about classification.
And as we saw with shapes, all of these choices make some features more important than others, make some distinctions visible and other distinctions invisible, and make some things easy to classify while others become outliers.
Let’s take a closer look at how this plays out in real machine learning applications. One straightforward example is in supervised object detection tasks.
For example, let’s imagine we want to train an object detection model on a dataset including this image:

We could give it the following ground truth bounding boxes:
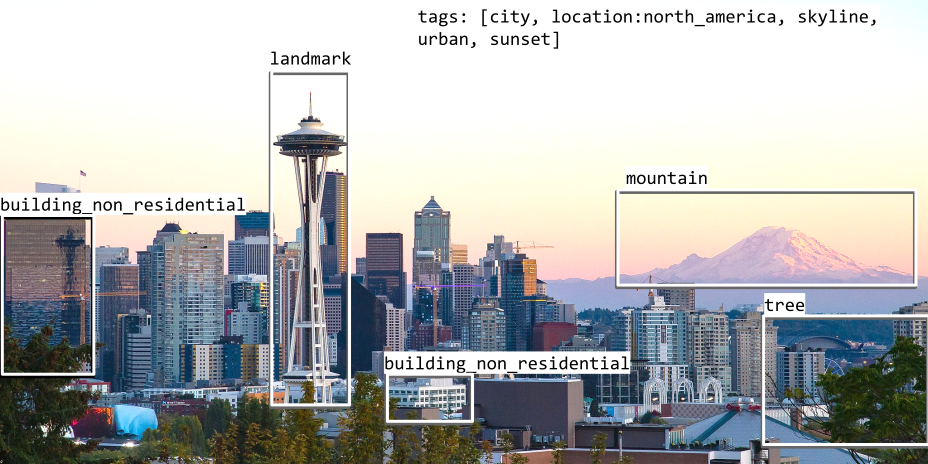
This looks objective, right? After all, a building is a building, a bush is a bush, and a mountain is a mountain!
But even labeling the same regions in the same image, you can communicate a very different perspective:
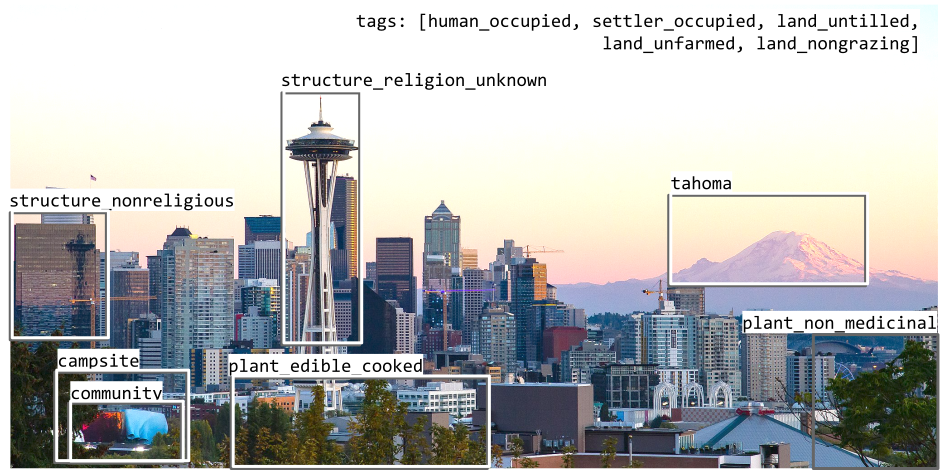
Or consider the image below, with several sets of “ground truth” labels. Looking at each of these labels, consider:
What features matter? What gets labeled? Whose worldview comes through? What might you learn from this set of labels that you wouldn’t learn from another?
There is no “view from nowhere”, no universal way to organize every object, or word, or image. Datasets are always products of a particular time, place, and set of conditions; they are socially situated artifacts. They have histories; they have politics. And ignoring this fact has very real consequences.
So what do we do with this information?
A great place to start is to reflect on your own context and get curious about your data.
If it’s hard to see a dataset’s values—if it feels “objective”, “universal”, or “neutral”—it may simply be reflecting a worldview you’re accustomed to. So, understanding the limitations of your own worldview can tell you about the limitations of “objective” data. What assumptions do you make about the world? What feels like common sense? What feels foreign?
And do some sleuthing about your data! Who collected this data? Why was it collected? Who paid for it? Where did the “ground truth” come from?
You might even find yourself questioning what kinds of assumptions underpin machine learning dataset development or even thinking more deeply about classification as a whole.
If you find yourself with lots of questions, you’re already off to a good start.
Dylan Baker // January 2022
Thanks to Adam Pearce, Alex Hanna, Emily Denton, Fernanda Viégas, Kevin Robinson, Nithum Thain, Razvan Amironesei, and Vinodkumar Prabhakaran for their help with this piece.